- About
-
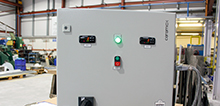
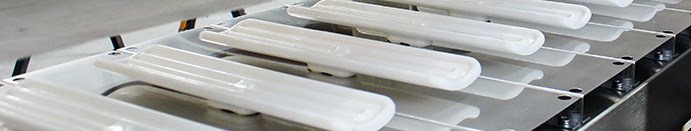
- Heating Solutions
-
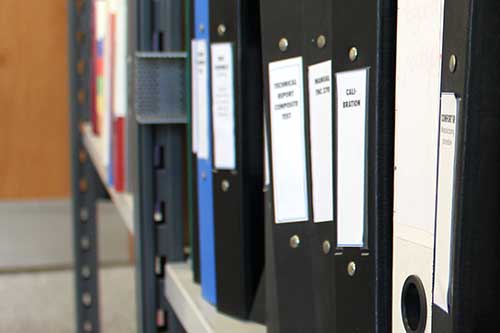
- Information
-
-
-
-
-
Latest Blog
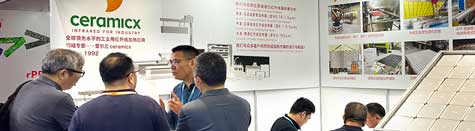
Chinaplas 2025
Chinaplas is an annual exhibition for the plastics and rubber industries which rotates location annually, between Shanghai in East China ... Read moreChinaplas 2025
-
-
-